Debugging APIs for mobile apps can be a tedious and frustrating task, especially when unexpected errors occur during testing. As developers, we’ve all been there – from dealing with specific bugs that only manifest on physical devices to not having access to the mobile app’s source code or the necessary devices to test it on. And let’s not forget the struggle of setting up the testing environment and debugging the code remotely. But fear not, fellow developers! In this blog, we will explore some effective strategies for debugging APIs in mobile apps.
Motivation
Whether you’re responsible just for the backend or are developing the entire stack for a mobile app, I’m sure you’ve had problems when testing the backend. Some of the problems I’ve personally had were:
- Some very specific bugs happened only on physical devices and couldn’t be replicated on an emulator, so the app had to be run on the device while connecting to the locally running backend. Exposing the endpoint from the local machine and connecting the app is tedious and overly complicated, the network had a firewall, the app needed to be recompiled with a new endpoint and a bunch of other small steps. I did have access and could compile the mobile app but it was still annoying.
- I had no access to the source code of the mobile app and bothering the mobile team to recompile the app with my specific local endpoint would take a while, and they have their own work.
- The problem happened on iPhone, and I don’t have it.
- I don’t want to use emulators because they generally suck.
- Sometimes you get an idea on how to fix something, but you’re not sure if it’s a complete fix, and you’d like the QA to give it a go before you finish the code, write tests, cover edge cases, and deploy it to the testing environment. But that might be a hassle to set up and you’re not sure if it’s a correct fix so you couldn’t be bothered to deploy it. And you can’t really debug (sure, you can try remote debugging, but you won’t).
Luckily, there are two tools that come to the rescue!
ngrok
The first tool for debugging APIs I’d like to mention is ngrok. Basically, it will run on your machine, and create a publicly available endpoint that routes to your machine, to whatever localhost port you decide. It has a free tier that should be enough for most of your needs.
After you install it (or just download and extract it on Windows), the command you need is ngrok http 5336 (if your local app is running on port 5336) and ngrok will dump out the publicly accessible https endpoint e.g. http://d3d18f12.ngrok.io and https://d3d18f12.ngrok.io which you can use to connect from the outside. If your local service is on https, you’re going to have to put in ngrok http https://localhost:5336/
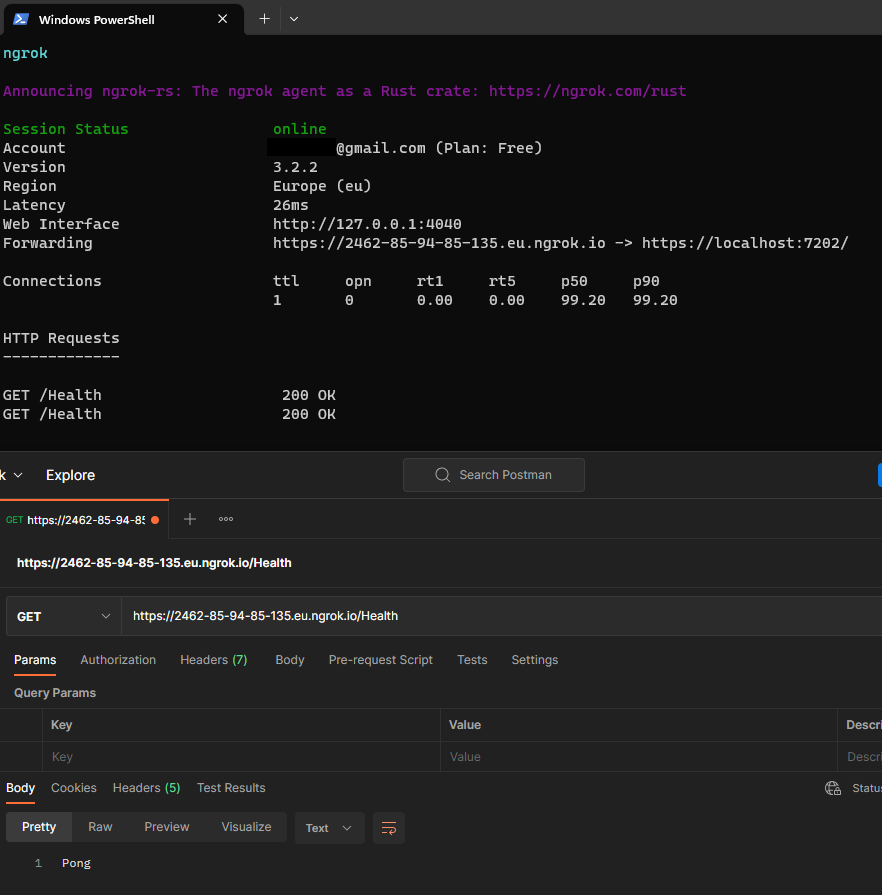
On the bottom: postman requests on the publicly available endpoint from ngrok.
If you pay a bit, you’ll get your own “domain”. Then, you can have the backend-dev builds of the app which will connect to your locally running backend.
Charles
Secondly, there is a not very well-known tool that can also help in the debugging process. Charles is a feature-rich proxy application, but we’ll focus on a couple of features I found most useful while working on backends for mobile apps.
Although it’s not as popular as some other debugging tools, I have found it to be incredibly useful. Don’t be fooled by the look of the website and the app itself, it’s almost a godsend. It has a thirty-day free trial, and after that, it’s a one-time purchase of USD $50, which is nice to see in today’s age of subscription-based software.
Setting up Charles
Once you install the software, setting up is a bit more work than ngrok:
- Start the app and enable the proxy. If you’re on VPN, connect to the VPN first then start the proxy.
- In recording settings, set everything you want Charles to record (all the URLs, hosts, ports, etc.)
If you want to forward the requests from the app to your backend, continue with the following steps:
- Start your backend
- In mapping of remote settings, redirect the incoming request from some host (or full URL) to your localhost.
- In the help menu, check out your local machine’s IP address and the port Charles is listening on.
- On you’re mobile phone, connect to the same network as your computer is in and set the network proxy to the values from step 3.
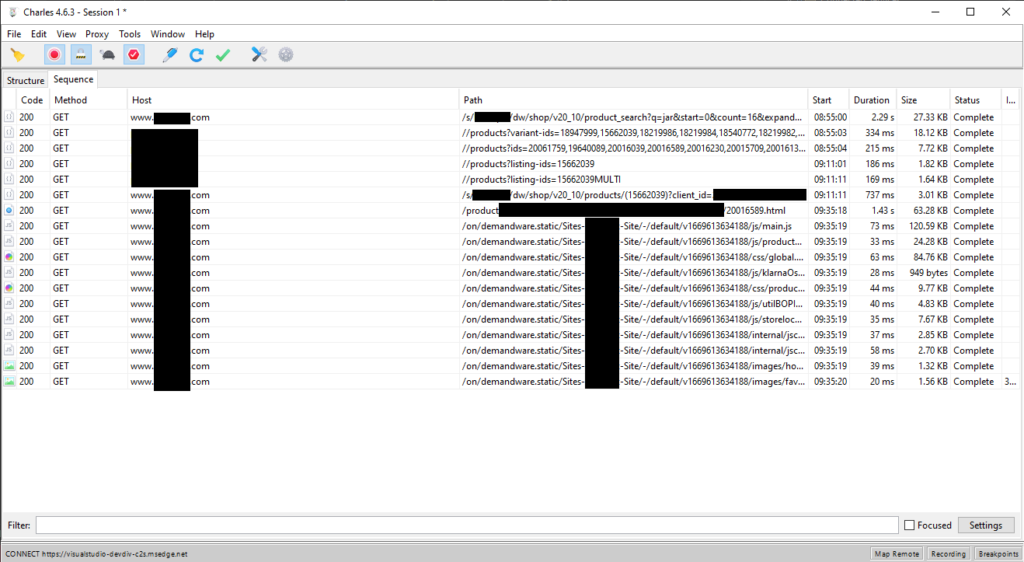
- Start sending requests from the mobile app. They should start appearing in the Charles. You can see the requests and responses’ bodies, headers and other interesting values. If some requests are over SSL, you have the option to right-click on that request and select SSL Proxying. That way, Charles is basically performing the man-in-the-middle attack, so you can actually see the content of even the https message.
Charles Features
Some other notable features are copying a request as a cURL command for easy importing and sharing with people. You can add breakpoints to some requests, and modify either the request or response. You can view by structure (nice tree view grouped by URL parts or as they happened in time). In addition, you can delete some recorded requests and save them as a file, which you can then send around and import into Charles. It’s also a beautiful addition to bug details, instead of a long explanation of steps.
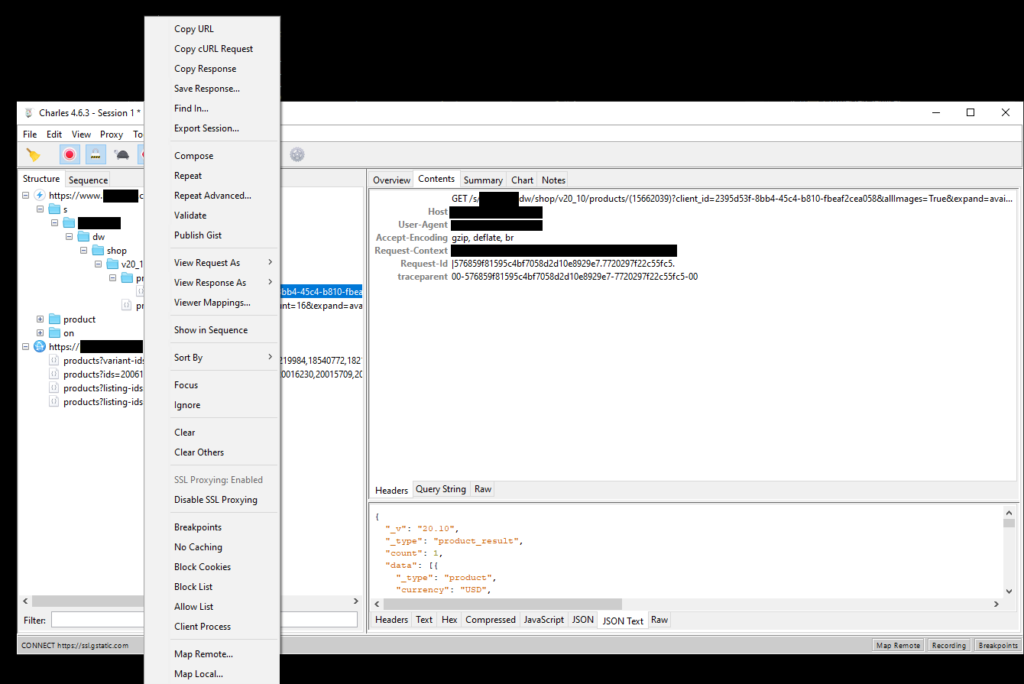
In this screenshot, we have SSL proxying enabled to selected endpoints so the content of the request and response is extracted. You can also see various options like copy as cURL, breakpoints and various others.
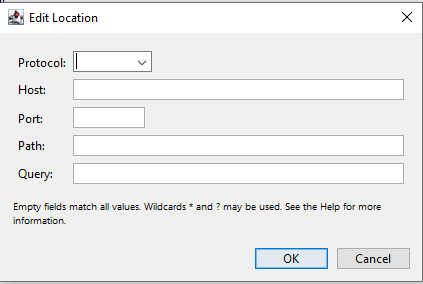
https://example.com/api/query?test=1. Or you can use a wildcard in any of the fields.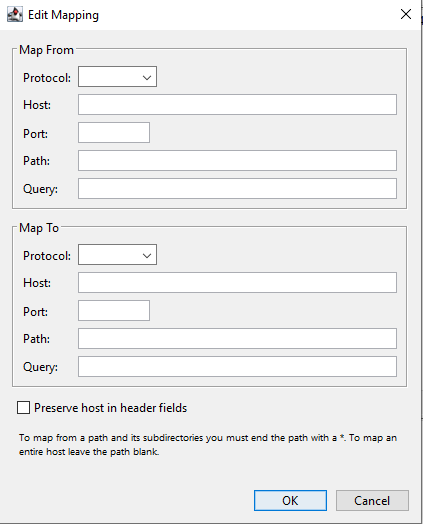
So you can set that
https://example.com/api/query?test=1 should go to http://localhost:4200/query?test=1 if you want. Or even that everything going to example.com should map to localhost.There are heaps more options in Charles but these are the ones I found more useful. The documentation is quite extensive, so have a look.
Conclusion
Remember to stay patient, persistent, and open to trying new things when it comes to debugging APIs. With the tips and insights shared in this article, you’ll be well on your way to mastering the art of mobile app API debugging.
Hope it helps and if you have any stories or suggestions for tools that helped you, or would just like some help with the setup of Charles, drop me a message.